
Categories
Market Update, Home Values, Real Estate Trends, Santa Clara CountyPublished May 30, 2026
Why National Housing Headlines Break Down in Santa Clara County

National housing commentary is useful — until it starts treating every market like it behaves the same way.
That’s where consumers get misled.
A lot of the national news reaching homeowners and buyers paints real estate with too broad a brush. Not intentionally. That’s just what happens when large datasets are used to explain a very local business. And one of the most common examples is when broader Bay Area discussion quietly leans on San Francisco as a stand-in for the region. Not explicitly, maybe — but often implicitly.
The problem is that Santa Clara County is not San Francisco.
And even more importantly, Santa Clara County is not one market.
The latest numbers from our Home Values Shift database, using the most recent single-family median sold price data for April 2026, show just how dramatically local the market really is.
At the same time that some areas are flat — or even down — others are still showing real strength. And when you zoom out to compare today’s pricing to the 2022 peak, the story gets even more interesting: some markets have recovered and pushed higher, while others are still materially below their peak.
That’s exactly why buyers, sellers, and homeowners need more than headlines. They need local context.
One County, Completely Different Market Stories
If you only consumed national or regional housing commentary, you might assume the market is moving in one direction.
But Santa Clara County’s latest median sold price shifts tell a very different story. (all data is for Single Family Residences only)
April 2026 year-over-year median sold price change
- Mountain View: +23.1%
- Willow Glen: +11.4%
- Campbell: +6.8%
- Almaden Valley: +6.7%
- Evergreen: +6.3%
- Alum Rock: +5.8%
- South San Jose: +4.7%
- Saratoga: +4.0%
- Santa Teresa: +2.2%
- Los Altos: +1.0%
- Cambrian: +0.3%
At the same time:
- Central San Jose: -1.2%
- Santa Clara: -2.0%
- Gilroy: -2.3%
- San Jose overall: -4.0%
- Blossom Valley: -5.2%
- Berryessa: -8.5%
- Sunnyvale: -9.3%
- Cupertino: -12.5%
- Los Gatos: -13.6%
- Milpitas: -13.7%
- Morgan Hill: -25.9%
That is not one market trend. That is a patchwork of local conditions playing out at the same moment, inside the same county.
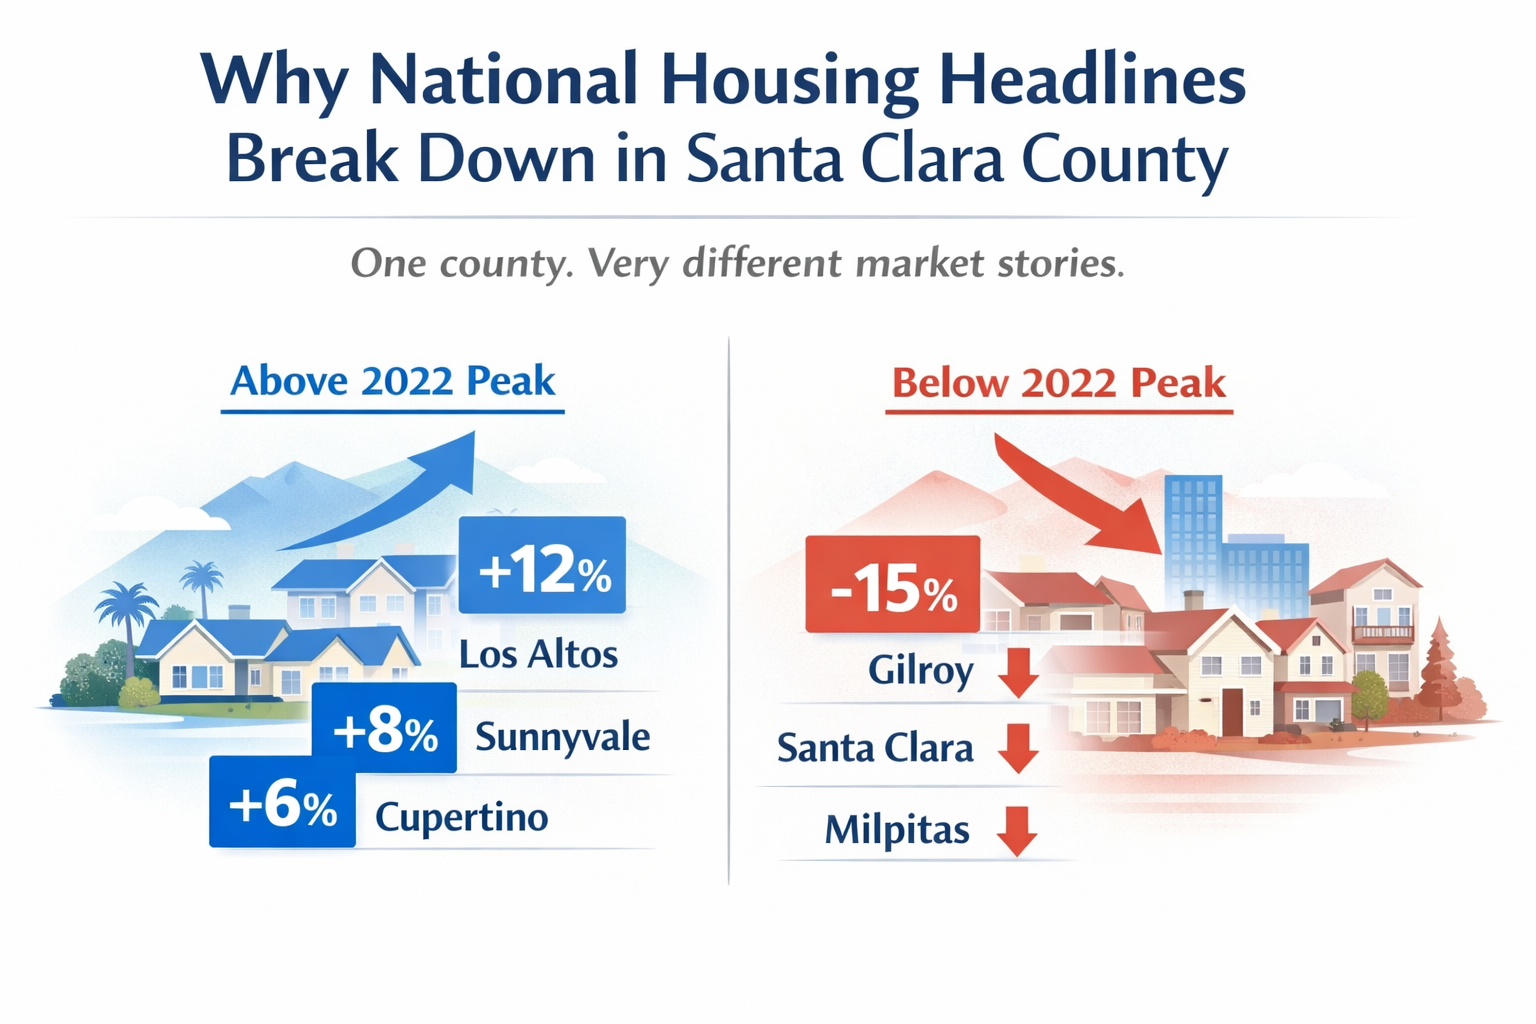
The 2022 Peak Still Matters — Because Trends Can Change Fast
This is where broad narratives really start to fall apart.
If you only look at the last 12 months, you get one story. If you compare current prices to each market’s 2022 peak, you get another. And the gap between those two views tells you just how fast local trends can change.
Markets still well above their 2022 peak
- Mountain View: +30.0%
- Willow Glen: +19.0%
- Campbell: +17.9%
- Evergreen: +17.2%
- Santa Clara: +10.0%
- Los Altos: +9.8%
Markets hovering near peak
- Cupertino: -0.6%
- Blossom Valley: -0.8%
Markets still notably below peak
- Central San Jose: -7.0%
- Milpitas: -8.2%
- South San Jose: -8.2%
- Gilroy: -9.1%
- Berryessa: -13.7%
- Morgan Hill: -13.7%
- Los Gatos: -15.8%
That spread is the point.
A market can look soft on a year-over-year basis but still be near prior highs. Another market can look stable over the last month or two yet still be meaningfully below its 2022 peak. And another can be doing both — rising now and far above prior highs.
A few examples:
- Cupertino is down 12.5% year over year, but only 0.6% below its 2022 peak.
- Los Altos is up just 1.0% year over year, yet still sits 9.8% above peak.
- Mountain View is not just strong year over year at 23.1% — it’s also 30.0% above its 2022 peak.
- Los Gatos posted a strong 12.7% month-over-month gain, but is still 13.6% down year over year and 15.8% below peak.
That’s why “the market is up” or “the market is down” is usually too simplistic to be useful.
The County-Level Headline Misses the Point
Countywide, San Jose single-family median sold price came in at $1.693M in April 2026, down 4.0% year over year, down 4.0% month over month, and 1.9% below the 2022 peak.
If you stopped there, you could walk away thinking the county is simply softening.
But that interpretation falls apart as soon as you zoom in.
- Mountain View: $3.315M, +23.1% YoY, +30.0% vs peak
- Willow Glen: $2.500M, +11.4% YoY, +19.0% vs peak
- Campbell: $2.576M, +6.8% YoY, +17.9% vs peak
- Morgan Hill: $1.338M, -25.9% YoY, -13.7% vs peak
- Milpitas: $1.423M, -13.7% YoY, -8.2% vs peak
- Berryessa: $1.510M, -8.5% YoY, -13.7% vs peak
- Los Gatos: $2.906M, -13.6% YoY, -15.8% vs peak
That’s why the “Bay Area market” framing so often fails consumers. Because the reality on the ground is far more segmented.
Volume and Demand Reinforce the Same Lesson
Prices are only part of the picture.
The latest sales count and pending absorption data also reinforce how local this market is.
Year-over-year sold count changes in April 2026
- Evergreen: +28.2%
- Mountain View: +24.0%
- South San Jose: +23.8%
- Santa Teresa: +22.2%
- Campbell: +15.0%
- Gilroy: +46.8%
Meanwhile:
- Milpitas: -58.3%
- Morgan Hill: -46.2%
- Cupertino: -25.0%
- Santa Clara: -23.1%
- Cambrian: -19.6%
Absorption rates tell a similar story. Mountain View and Almaden Valley showed stronger pending-sales absorption than a year ago, while Sunnyvale, Santa Clara, and Cambrian showed softer conditions.
Again: not one market.
Why This Matters for Homeowners and Buyers
If you are a homeowner, broad national narratives can distort your expectations in both directions.
If the headlines are negative, you may assume your equity has stalled when your local market is actually holding firm or climbing. If the headlines are optimistic, you may assume your area is stronger than it really is.
For buyers, bearish national coverage can create false confidence that every local market is getting easier. That is simply not how this county works.
The better question is not: “What is the housing market doing?”
The better question is: “What is my market doing — in my city, my neighborhood, my price point, and my property type?”
That’s where strategy starts.
The Real Value of Local Knowledge
Data matters. Broad trends matter.
But in housing, geography wins.
You cannot make smart decisions in Santa Clara County by relying on national averages or region-wide shorthand. The spread is too wide. The behavior is too local. And the market can change direction faster than people realize — especially when measured against both the last 12 months and the 2022 peak.
That’s why local knowledge still matters so much.
Not because it replaces the data. Because it interprets it correctly.
The job is not to ignore the national narrative. It’s to test it against local reality.
And when you do that in Santa Clara County, the conclusion is clear:
There is no single story here.
Some markets are flat.
Some are negative.
Some are on fire.
And the people who understand the difference are the ones best positioned to make smart real estate decisions.
Your Move
Whether you're looking at the chart above thinking "we should sell now" or "maybe this is finally our window to buy" — both instincts deserve a hyperlocal conversation, not a national headline.
The data is neighborhood-specific. The strategy should be too.
Want to see exactly where your home or target area falls in this picture? Let's look at the numbers together. Reach out directly — that's what I'm here for.

Carol Cruz
Operator | Cruz Living | Real Estate Experts


or another way